Cohort analysis is a form of behavioral analytics that sorts customer data into smaller groups based on similar traits, and then analyzes the behavior of the groups to uncover patterns. Those patterns can inform strategic decision-making and product development. While primarily a tool employed by marketers, cohort analysis is also used for a variety of other business purposes, including new customer acquisition, customer retention, constituent engagement, and user adoption.
A business’s customers are not a monolith—they’re individuals with individual preferences and behaviors. Sometimes looking at aggregate data about customers can mask issues that drive certain subsets of them to abandon products or services. A lot of businesses just look at top line numbers—the number of new customers or monthly sales, for example—to measure how they are doing. But this can mask underlying issues holding them back from even better performance.
Behavioral analytics is the use of qualitative and quantitative data to track and understand customer behavior. It is used for marketing, product development, forecasting, customer service, and security. Cohort analysis is a form of behavioral analytics that provides the ability to uncover insights about customers’ behavior in the context of their relationships with your business by sorting customers into groups, or cohorts, according to certain shared characteristics. For example:
Learn about the difference between data analytics and data science.
Why use cohort analysis? It can help you discover patterns of behavior and unearth contextual insights about actions you can take to help convert or retain certain groups of customers. It can also help you to do the following:
Cohort analysis breaks down customer data to find patterns that allow you to group customers together into cohorts that are more useful than aggregate data. Performing this analysis is done in several steps.
As with any data analytics project, the first step in cohort analysis is to determine your goal. What actionable insight are you seeking? Asking the right question can be a challenge—it helps to think about your business’s larger strategic goals and how customer actions contribute to achieving them. For example:
The next step is to identify which metrics will provide the data you need. Many sources provide insight into customer behavior, including CRM platforms, web/e-commerce analytics, survey data, and email marketing software. The more historical data you collect—and the more granular it is—the better the result.
The metrics may be collected in more than one source. A data dictionary can provide a more holistic picture of what is available. If you are using data from multiple sources, transform and clean it to make sure you get the best results—a data analytics platform or data quality tool will help ensure that you are working with accurate and complete data.
There are a variety of ways to group customers, from time-based attributes to attributes based on events or size, for example. You might group customers who made a purchase in the month before Christmas, for example, or customers who bought more than three products or services within a six-month period. Your goals will help determine these definitions.
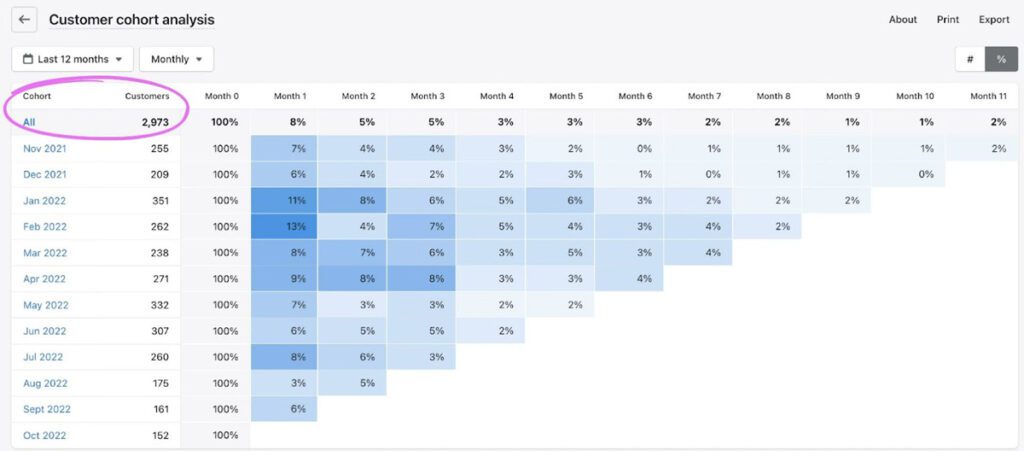
The results of your cohort analysis can be displayed in a chart, graph, or table—many data analytics platforms have some form of cohort analysis functionality built into the software. A cohort analysis chart displays data using rows to capture each group and columns displaying the values of the action you are tracking over time.
The data can be read across to see how a cohort performs over time; from top to bottom, to see how different cohorts behave during a specific time period; or diagonally, for a snapshot of how they behave at a certain point in time.
The two most common cohort categories used in this type of analysis are acquisition cohorts and behavioral cohorts. Acquisition cohorts group customers by their first contact with your product or service; they are commonly used to measure retention or churn rates over a specified period of time.
Behavioral cohorts group customers by their behaviors related to your product—they can be used to measure things such as the characteristics of users who purchase a specific item or reach out to customer support. Within these two categories are several frequently used sub-categories of cohorts.
This subset of behavioral cohorts groups customers based on a specific event or action—for example, all users who purchased an item during a Black Friday sale.
This groups customers based on a specific timeframe—for example, all users who downloaded a fitness tracking app in January.
This groups customers by size, such as net worth or number of employees—for example, all customers who are small businesses.
This groups customers according to their stage in a funnel—for example, all the people who have put an item in their online shopping cart but have not started the checkout process.
Cohort analysis is a useful behavioral analytic tool for optimizing business and marketing efforts and deepening engagement with customers. Understanding customers and their behavioral triggers is valuable for growing your business and strengthening your existing customer base. It also can help you adjust to changes in behavior over time. Cohort analysis allows you to identify patterns of behavior as a customer’s relationship with you evolves, which gives you the ability to adjust your interactions to meet these changing relationships.
Cohort analysis can also provide an early warning system for potential issues with existing customers. By visualizing differences in how high-value and lower priority customers respond to certain actions and circumstances, you can quickly pivot if you see an action having a negative impact on your high-value customer retention rates.
Cohort analysis can also lead to Improved conversion rates. Tracking prospects acquired during a specific timeframe or from a certain source can help you determine if there are particular actions that make cohort members more likely to make a purchase.
Businesses can use cohort analysis in myriad ways. Here are a few examples of real-world and hypothetical applications.
The Target chain used historical purchase data from women who signed up for its baby registry to determine the patterns of buying that might indicate a customer’s pregnancy. Using that information, the chain began sending coupons for baby-related products to customers with similar purchase patterns. While the analysis proved accurate, it also unnerved the cohort—based on feedback, Target instead began to deliver personalized coupons mixed in with other offers.
Several airlines have recently made changes to their lounge access policies based on cohort analysis. Research has shown that lounge access is important to the airlines’ most profitable segment of travelers, frequent business travelers—however, branded credit cards opened up lounge access to greater numbers of people, resulting in overcrowding and less satisfaction from priority users. As a result, several airlines tightened the rules on lounge access to improve the experience for their most frequent fliers and avoid the likelihood of this cohort switching to a different brand.
App developers often use cohort analysis to track downloads and daily usage, which helps them determine whether adjustments need to be made to improve new-user retention and decrease churn. It can also help fine-tune pricing for premium content and in-app purchases.
Cohort analysis makes it possible to separate growth metrics from engagement metrics—rather than looking at high level numbers, it lets you drill down into the details to see if certain segments of your audience are performing more poorly than others. It can also provide clues about why this is happening.
As part of their larger analytics strategy, businesses can use cohort analysis to optimize their marketing and outreach, better target customers with personalized campaigns, forecast and resolve issues based on pattern behavior, and improve conversion rates.
Read What is Predictive Analytics? to learn more about the different analysis tools in enterprise toolboxes.

Datamation is the leading industry resource for B2B data professionals and technology buyers. Datamation's focus is on providing insight into the latest trends and innovation in AI, data security, big data, and more, along with in-depth product recommendations and comparisons. More than 1.7M users gain insight and guidance from Datamation every year.
Advertise with TechnologyAdvice on Datamation and our other data and technology-focused platforms.
Advertise with Us


Property of TechnologyAdvice.
© 2025 TechnologyAdvice. All Rights Reserved
Advertiser Disclosure: Some of the products that appear on this
site are from companies from which TechnologyAdvice receives
compensation. This compensation may impact how and where products
appear on this site including, for example, the order in which
they appear. TechnologyAdvice does not include all companies
or all types of products available in the marketplace.