Quantitative data is information restricted to numerical values, making it quantifiable and amenable to statistical analysis. It includes objective and observable information stated in specified units—for example, height, temperature, income, sales figures, population size, test scores, and weights are the types of information that is considered quantitative data. These numerical representations allow quantitative data to be mathematically examined, allowing patterns and correlations to be identified.
This distinguishes it from qualitative data, which is descriptive, non-numerical data that captures insights into human experiences, emotions, and perceptions. A successful enterprise data strategy includes both quantitative and qualitative data, which together can provide a more holistic, nuanced picture.
Quantitative data is invaluable when seeking a deeper knowledge of occurrences that can be properly quantified and stated numerically. This analytical technique enables a thorough evaluation of quantifiable properties, allowing for a more in-depth exploration of patterns, correlations, and trends within the data.
By relying on numerical values, quantitative data not only improves the precision of analysis but also offers a firm platform for statistical interpretations and evidence-based decision-making. As a result, it has become a vital tool in a variety of professions, allowing researchers to delve into the quantitative parts of complicated topics and develop meaningful conclusions supported by numerical data.
Quantitative data is represented numerically and is classified as discrete or continuous to allow for accurate measurement. Its intrinsic order makes it possible to rank items based on magnitude, for example, arithmetic operations may be applied for mathematical analysis. Quantitative data adheres to established scales, improving consistency and comparability across diverse measures.
Its analytical potential is further enhanced by its statistical analysis capability, which allows for examining patterns, trends, and correlations within the dataset. These characteristics allow quantitative data to be efficiently presented using visualizations to provide a clear and succinct portrayal of the underlying patterns and insights.
Quantitative data may be classified into several forms, based on the nature of the study and the measuring scales used. Each sort of quantitative data serves a particular research purpose. Which to employ is determined by the research question, design, and features of the variables being researched. The following are eight of the most commonly used types of quantitative data:
Quantitative data is an important tool for actively seeking answers to questions like “what” or “how many.” This data type uses numerical values to measure and quantify various aspects of a phenomenon or population, allowing for precise analysis and statistical interpretation.
When actively researching the quantity or extent of a certain variable, researchers use quantitative approaches that allow the application of mathematical tools to discover patterns, trends, and correlations within the data. The active use of quantitative data—whether measuring heights, weights, temperatures, or counting occurrences—offers an organized and objective method for answering particular queries and reaching relevant conclusions.
Quantitative data offers advantages like objectivity, statistical robustness, and broad generalizations.
Because quantitative data is objective and less impacted by personal prejudices, the conclusions are more reliable.
Quantitative data permits statistical analysis, allowing researchers to detect patterns, trends, and correlations with great accuracy, revealing the significance of relationships and providing a solid foundation for evidence-based decision-making.
Numerical comparisons between variables makes it easier to quantify and convey correlations, facilitating a better understanding of the data among researchers and stakeholders.
Findings are frequently more generalizable to bigger groups, yielding greater insights and extending the applicability of research findings beyond the studied sample, contributing to the development of broader theories and principles.
Efficient and quick collection can gather a large quantity of information in a short period, saving time and enabling researchers to promptly address research questions and adapt to dynamic situations.
Methodical and structured approach to study allows for a greater understanding of links and patterns, making discoveries more relevant; also conducive to replication, enabling other researchers to conduct similar studies and compare outcomes, contributing to the robustness of scientific knowledge.
Despite its benefits, quantitative data has limitations—for example, it’s not great for expressing complex events and leans toward oversimplification.
Quantitative data can oversimplify things, ignoring their complexity and richness and leading to a loss of subtlety and a shallow comprehension of the subject.
By disregarding in-depth experiences and subjective interpretations in circumstances involving test-takers, quantitative data can lead to omissions or incomplete investigations.
Due to the difficulty of quantifying subjective experiences, quantitative data can lead to deceptive conclusions when dealing with emotions.
Numerical data is prone to deception or misinterpretation if not thoroughly studied, highlighting the significance of meticulous data interpretation to prevent incorrect conclusions.
Quantitative data tends to simplify complex phenomena, leading to sweeping conclusions that can incorrectly be applied more widely than justified.
Data that can be counted or categorized by its numerical value is often used to study events or levels of concurrence. Surveys, experiments, and statistical analyses are among the approaches used by researchers to efficiently gather, handle, and evaluate huge amounts of data.
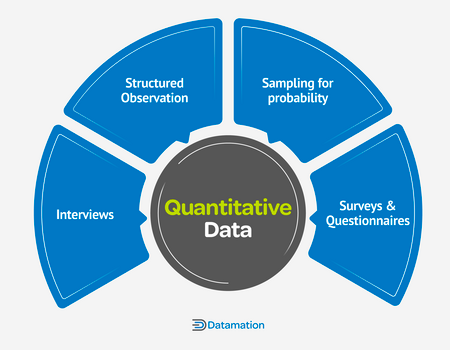
Structured observation involves systematically observing and recording certain actions or events. To maintain uniformity and objectivity, researchers adhere to specific standards created before the observation begins. This approach is especially beneficial for researching behaviors in natural settings since it allows for impartiality while monitoring individuals in their natural circumstances.
Probability sampling is a research technique that involves selecting a subset (sample) from a larger population in such a way that each member of the population has a known, non-zero chance of being included in the sample. The principles of probability theory drive this sort of sampling, allowing researchers to make statistical conclusions about the total population based on the features found in the sample.
Interviews are a means of gathering information from individuals or groups in which the researcher asks questions either orally or in writing. This kind of dynamic data collection allows for a more in-depth knowledge of participants’ viewpoints, experiences, and attitudes.
Surveys and questionnaires are popular instruments for gathering quantitative data because they allow researchers to obtain numerical information from a large sample of respondents in a systematic manner.
Quantitative data is anything that you can count and categorize according to its numerical expression. These examples demonstrate the breadth of quantitative data, which ranges from simple counts and measurements to more complicated experimental and survey-related data.
| Type of Quantifiable Data | Examples |
|---|---|
| Counts |
|
| Measurements |
|
| (Ordinal Data) Categories |
|
| Data Intervals |
|
| Data on Ratios |
|
| Survey Results |
|
The primary distinction between quantitative and qualitative data is found in their nature. Quantitative data consists of numerical measures that may be tallied or measured, with an emphasis on numbers. Qualitative data, on the other hand, is non-numerical and focuses on traits, attributes, or descriptions. Statistical analysis is commonly linked with quantitative data, but theme coding or narrative analysis is often used to evaluate qualitative data.
Quantitative data is numerical measurements that may be classified as discrete or continuous data. Categorical data, on the other hand, is made up of different categories or groups that are frequently represented by labels. While quantitative data can be mathematically processed, categorical data is often evaluated using frequencies and percentages. In essence, quantitative data is concerned with measuring, whereas categorical data is concerned with categorizing.
A histogram is the most popular graphical representation of quantitative data. Histograms show the distribution of numerical data by dividing it into intervals or bins along the x-axis and showing the frequency or count of observations in each interval on the y-axis. Histograms are frequently employed in statistical analysis and data visualization because they give a visual depiction of the data’s central tendency, dispersion, and form.
Quantitative data is a cornerstone for businesses, where it serves to fuel decision-making, operational knowledge, and strategic planning. Its numerical structure allows for exact measurements and detailed statistical analysis, which is valuable in the many enterprise use cases from acquiring actionable insights to making evidence-based choices and successfully managing complicated processes.
Enterprises can derive significant information from quantitative data by defining defined objectives and using rigorous data gathering procedures, which allows for objective comparisons and lays the groundwork for better informed decision-making processes.The standardized scales and quantifiable qualities inherent in quantitative data help to reliable and repeatable studies, improving the reliability and validity of findings that are crucial for firms looking to gain a competitive advantage in their markets.
If you’re learning about quantitative and qualitative data and how businesses use them both in their overall data management strategies, read our Complete Guide to Data Analytics for Businesses to see how they can be used alongside other types of data to provide a detailed picture of essential information.

Datamation is the leading industry resource for B2B data professionals and technology buyers. Datamation's focus is on providing insight into the latest trends and innovation in AI, data security, big data, and more, along with in-depth product recommendations and comparisons. More than 1.7M users gain insight and guidance from Datamation every year.
Advertise with TechnologyAdvice on Datamation and our other data and technology-focused platforms.
Advertise with Us


Property of TechnologyAdvice.
© 2025 TechnologyAdvice. All Rights Reserved
Advertiser Disclosure: Some of the products that appear on this
site are from companies from which TechnologyAdvice receives
compensation. This compensation may impact how and where products
appear on this site including, for example, the order in which
they appear. TechnologyAdvice does not include all companies
or all types of products available in the marketplace.