Big data analytics tools provide a wide range of capabilities to help enterprise organizations derive valuable insights from the vast amounts of data they collect. Because they’re designed to work with huge volumes of structured and unstructured data on a large scale, big data analytics tools generally have more specific features than other data analytics platforms.
To help you find the right tool for your business, we’ve reviewed the best big data analytics tools on the market—here are our picks for the top big data analytics tools for teams and businesses in 2024:
While the tools and software included in this list provide robust big data analytics features, each option has distinct offerings, as well as their pros and cons. Here’s an at-a-glance comparison of how each option stacks up in five major categories. Note that all per-user prices are with a one-year commitment, unless otherwise noted.
| Core Features | Advanced Features | Ease of Use | Customer Support | Pricing (Annual) |
|
|---|---|---|---|---|---|
| Zoho Analytics | Data integration, collaborative tools, security and governance | Business intelligence, AI assistant, data visualization | 3.6/5 | 3.4/5 | Free to $455 per user, per month for 50 users |
| Tableau | Data import and export, embedding playground, decision trees | Custom data labels, Tableau GPT, predictive modeling | 3.6/5 | 3.5/5 | $15 to $75 per user, per month |
| Microsoft Power BI | Self-service data preparation, products documentation, report themes | Advanced AI, dataflows, query catching | 3.6/5 | 3.2/5 | Free to $20 per user, per month |
| Oracle Analytics Cloud | Data import and export, mobile analytics app, data collaboration | Enterprise data modeling, Machine learning, developer tools | 3.1/5 | 3.4/5 | $16 to $80 per user, per month |
| SAS Visual Analytics | Text and visual analytics, forecasting, interactive dashboards | Augmented analytics, cloud native computing, chat-enabled insights | 3.6/5 | 4.3/5 | Contact sales for quote |
| Sisense | Data modeling and blending, visual dashboards, embed code | Generative AI, ad hoc analysis, data discovery | 3.9/5 | 3.7/5 | Contact sales for quote |
| TIBCO Spotfire | Visual analytics, Data preparation | Advanced analytics | 3/5 | 2.8/5 | Contact sales for quote |
| Splunk | Data Import and Export, Neural network | Artificial intelligence | 3.6/5 | 3.1/5 | Contact sales for quote |
| Looker | Market Basket Analysis, Time series | Machine learning, Business Intelligence | 3.4/5 | 2.5/5 | $5,000 per month (billed monthly) |
| Apache Spark | Real-time data stream processing, Lightning fast processing | Artificial intelligence, Advanced analytics | 3.6/5 | 1.3/5 | Free to use |
![]()
Best for self-service BI
Zoho Analytics is a self-service BI platform, which means you can easily extract insights from your data without the assistance of IT staff or professional data scientists. Users can gather and manage big data from multiple sources, including files stored locally, on cloud drives, web feed URLs, and even their companies’ custom-built applications. A series of permission levels let users ranging from C-suite pros to sales reps in the field access the data they need.

| Pros | Cons |
|---|---|
| Offers robust third-party app integrations | Advanced tools can be challenging to use |
| Provides transparent pricing and terms | Users report issues with data synchronization |
| Facilitates collaboration between teams | Declining performance with large datasets |
![]()
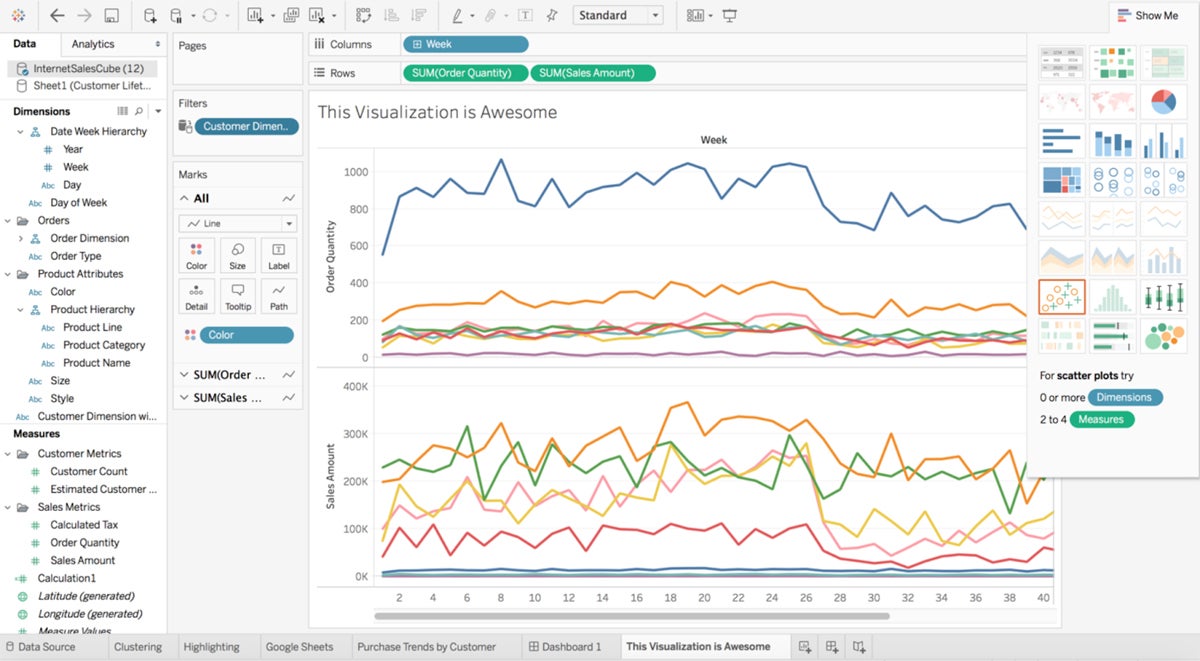
Best for data visualization
Tableau is a leading visual analytics platform with VizQL (Visual Query Language) technology, which powers visualization and interactive data exploration. Users can create data visualizations without the need to first organize data, which allows them to navigate through query languages even without prior knowledge. Tableau’s VizQL technology also works as a translator of structured query language (SQL) queries to easily turn tabular data into visual analysis.
| Pros | Cons |
|---|---|
| Allows users to create interactive visualizations | Platform can be resource intensive |
| Connects with a wide range of data sources | Reports need to be refreshed manually |
| Fast data lookup and analysis | Data processing feature can be lacking |
![]()
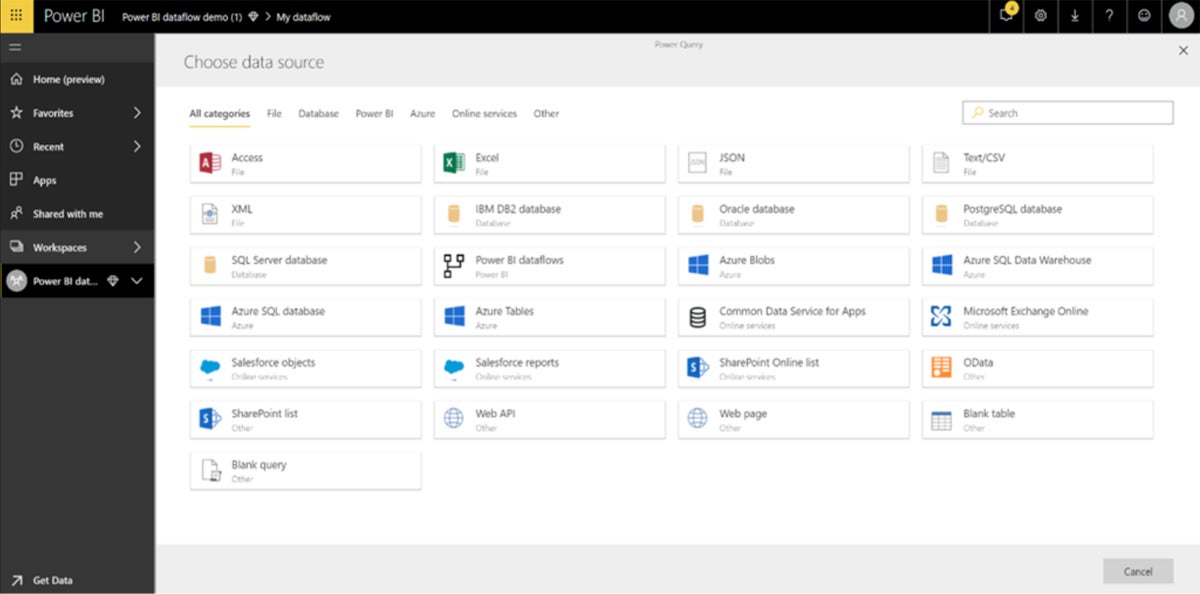
Best for big data preparation
Microsoft Power BI is a big data analytics tool with leading data preparation capabilities, including a self-service feature, AI-driven analytics, and a Common Data Model (CDM). Users can easily ingest, cleanse, and schematize data from a variety of sources and create workflows with familiar tools such as Power Query. Data engineers can also leverage Azure Data Services, while analysts can take advantage of CDM to ensure consistency in their business processes.
| Pros | Cons |
|---|---|
| Cost-effective and transparent pricing plans | Interface can be complex for beginners |
| Provides extensive documentation | Platform has limited online access |
| Best suited for Microsoft ecosystem |
![]()
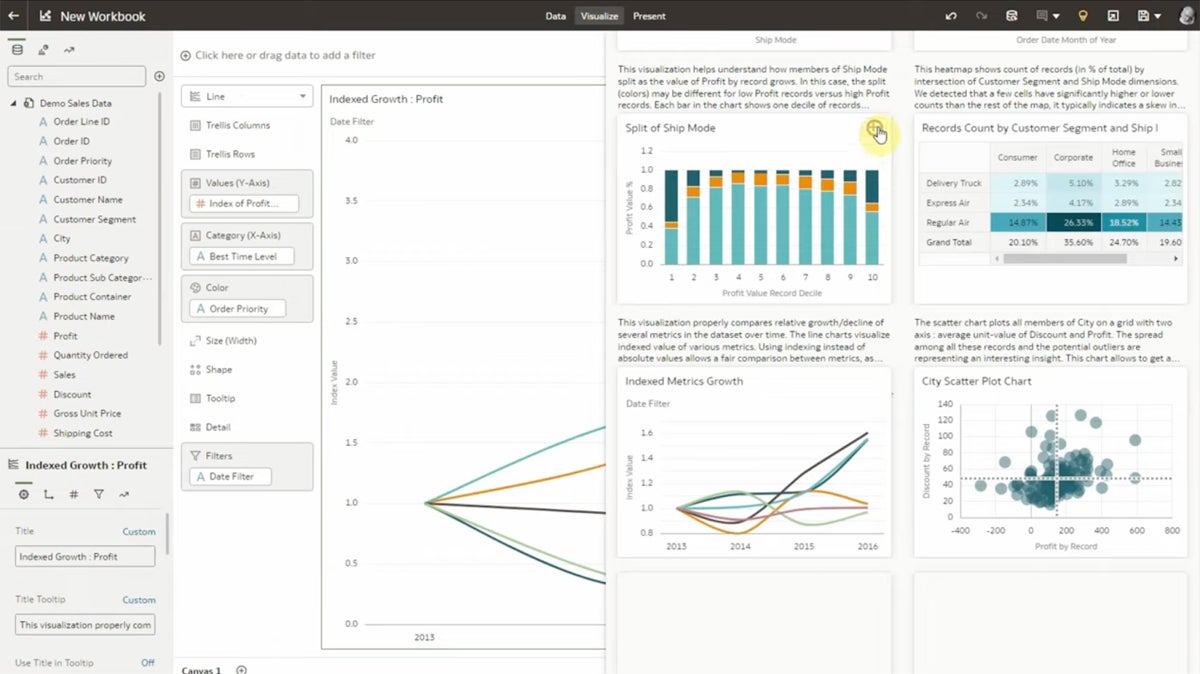
Best for automating analytics processes
Oracle Analytics Cloud is a big data analytics platform with automation capabilities for different types of analytics and big data analysis use cases. Organizations can set up triggers to send out analyses, dashboards, and other resources to targeted audiences on-demand or on a schedule. Organizations that are already used to using Oracle tools, including Oracle’s namesake database, will likely be the most attracted to the Analytics Cloud offering.
| Pros | Cons |
|---|---|
| Integrates data from a variety of sources | Dependent on data warehouse quality |
| Powerful data visualization | Limited offline access |
| Offers self-service data preparation |
![]()
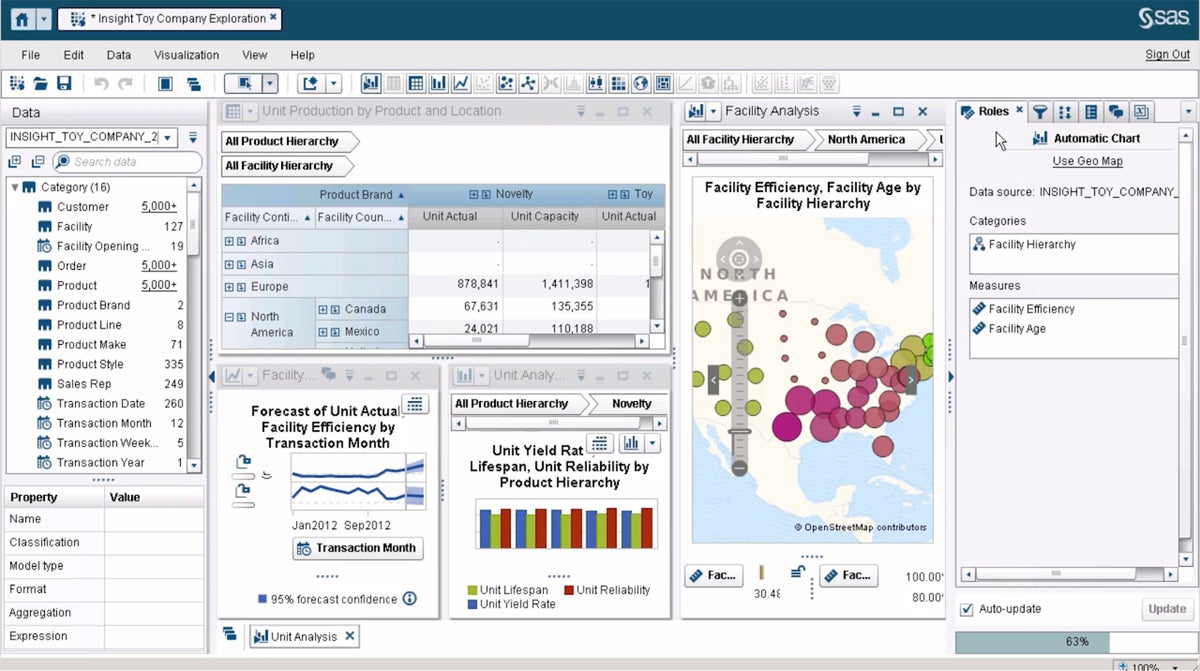
Best for visual data exploration
SAS Visual Analytics is a low-code analytics platform built for users and organizations looking for deep analytics tools. Create advanced visualizations with its drag-and-drop functionality and quickly identify relationships in data using suggestions and related measures. Leverage machine learning and natural language features for spotting, visualizing, and narrating insights, and automatically highlight key relationships, outliers, and clusters for in-depth analysis.
| Pros | Cons |
|---|---|
| Robust data visualization options | Dependent on SAS ecosystem |
| Suited for collaboration | Plans can be costly |
| Self-service analytics features |
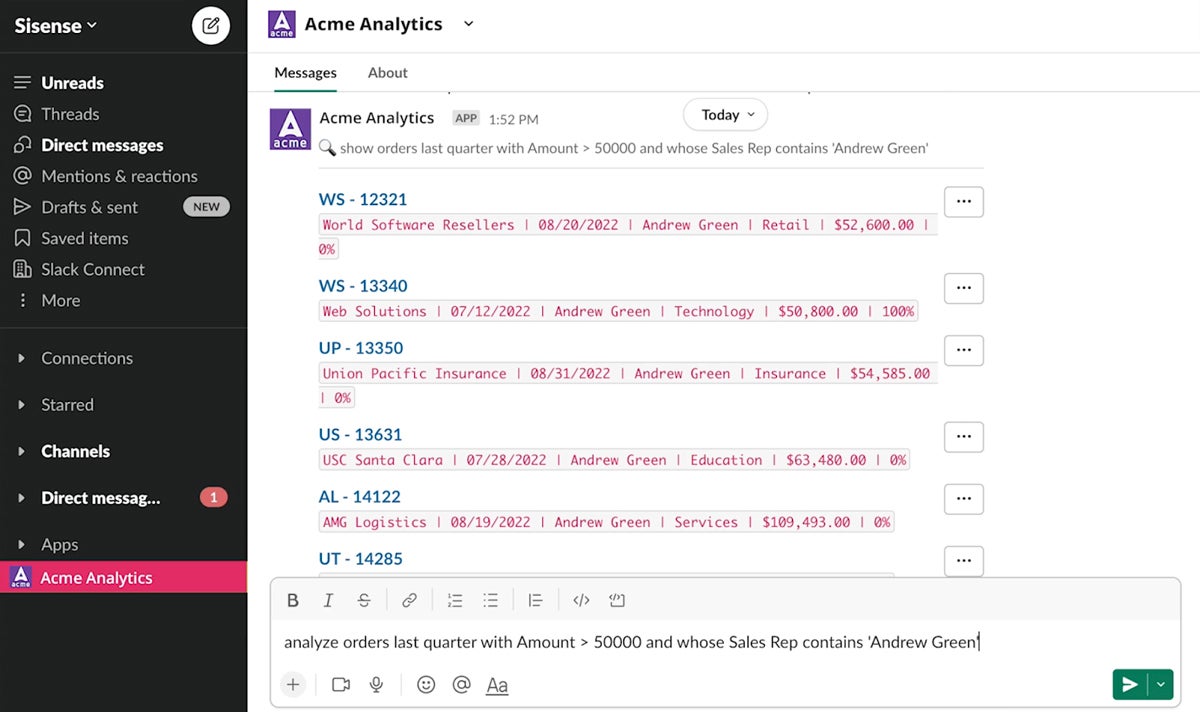
![]()
Best for embedded analytics
Sisense is a cloud-native BI platform offering an intuitive embedded analytics feature. Users can choose the method that works best for them, ranging from the pro-code Compose SDK to the no-code or low-code iFrame. Sisense is a good choice for larger organizations looking for fast implementation time. Its data visualization via the systems dashboard is often seen by users as being easy to use and as a time saver to get the required results.
| Pros | Cons |
|---|---|
| Robust embedded analytics feature | Can be resource intensive |
| High performance even with large datasets | Limited native data connectors |
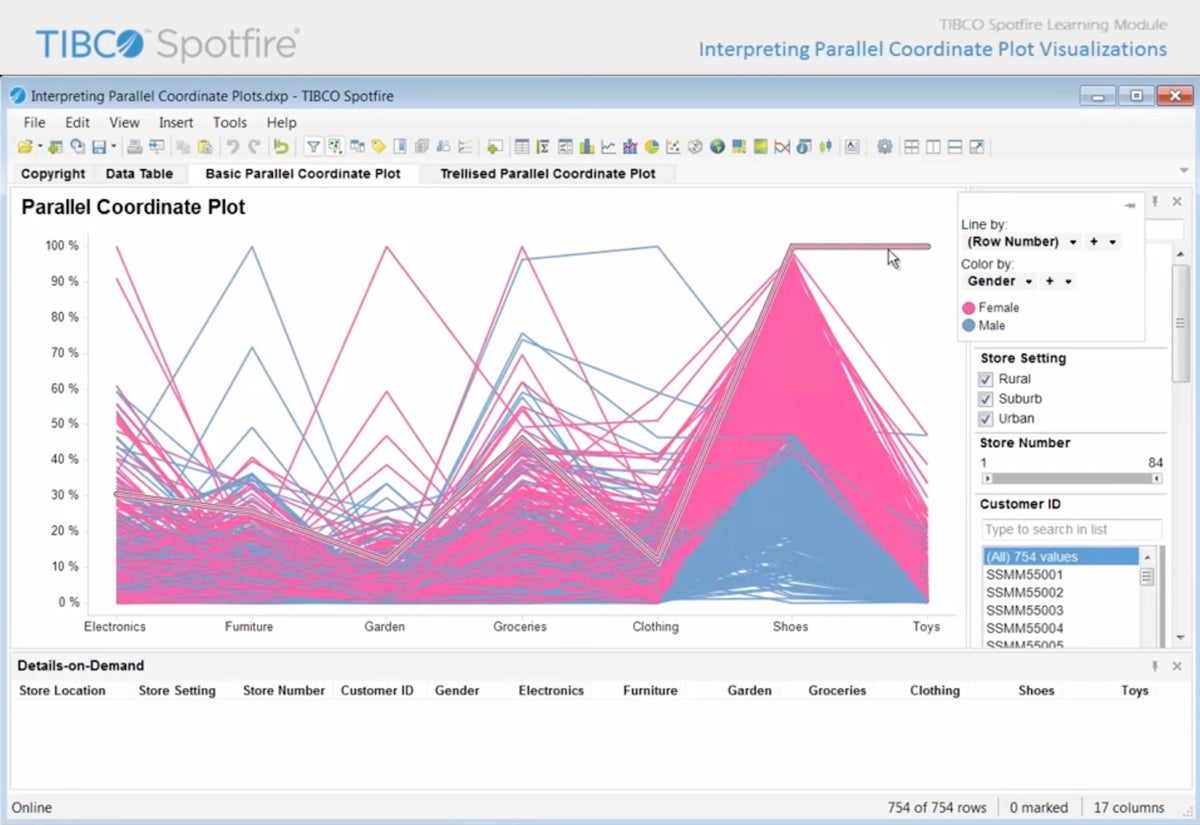
![]()
Best for advanced analytics
TIBCO Spotfire is an AI-based analytics platform offering powerful self-service analytics and data visualization tools for analyzing and sharing actionable insights. Users can combine data-at-rest with data-in-motion with Spotfire and ingest both structured and unstructured data from distinct sources. It also supports what-if analysis and prescriptive analytics across a wide range of use cases, so users can explore and model for insights most valuable to them.
| Pros | Cons |
|---|---|
| Robust embedded analytics feature | Can be resource intensive |
| High performance even with large datasets | Limited native data connectors |
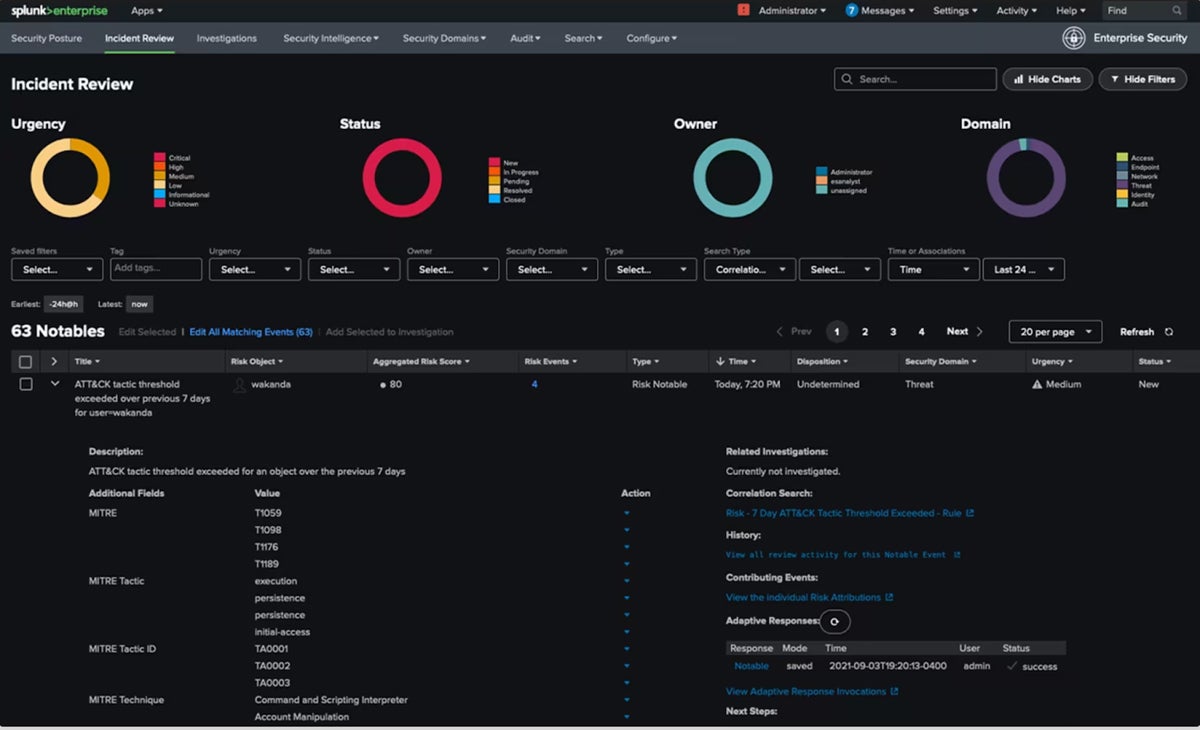
![]()
Best for Hadoop integration
Splunk is a software platform popular for its web-based log inspection and analytics capabilities, which enable users to look into big data stores in Hadoop systems. The platform benefits from a proven collaboration component and enables users to create and share graphs and analytics dashboards. For those organizations already using Splunk for log or other types of analysis, embracing Splunk Analytics for Hadoop is an easy step.
| Pros | Cons |
|---|---|
| Robust embedded analytics feature | Can be resource intensive |
| High performance even with large datasets | Limited native data connectors |
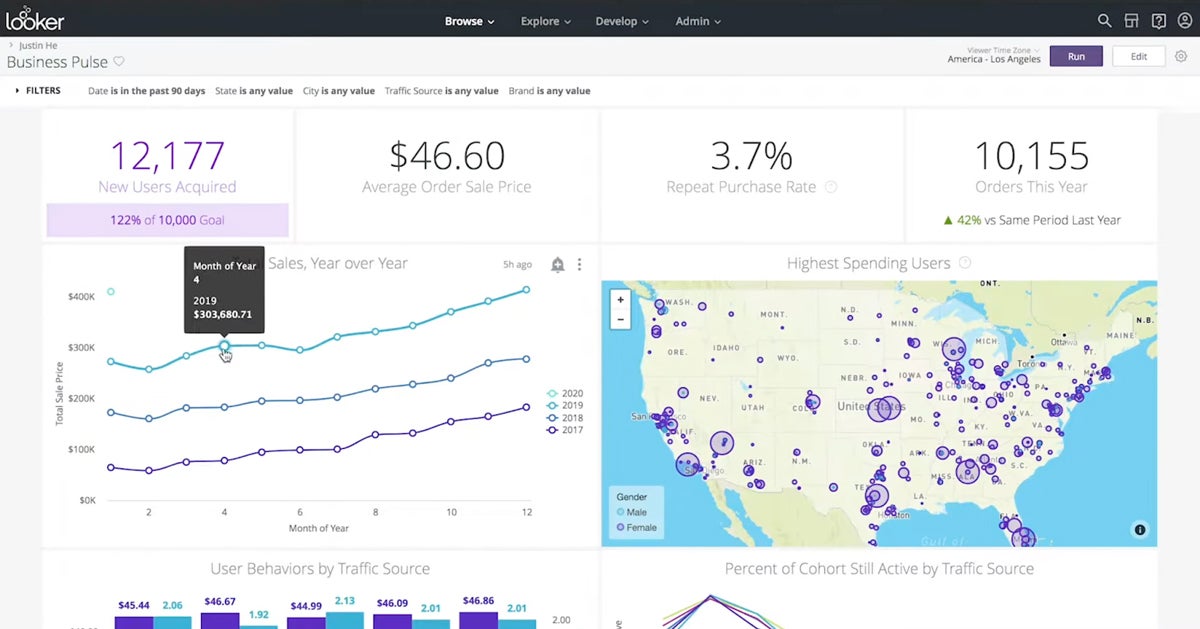
![]()
Best for data storytelling
Looker is a cloud-based BI platform designed to tell stories through reports and visualizations. Looker’s data model provides users with a consistent and governed real-time view of their data across multiple clouds, making it easier for businesses to build insight-powered workflows. Looker’s business intelligence feature, combined with Looker Studio’s customizable charts and interactive dashboards, helps users create more compelling and proactive insights.
| Pros | Cons |
|---|---|
| Robust embedded analytics feature | Can be resource intensive |
| High performance even with large datasets | Limited native data connectors |
![]()
Best for big data workloads
Apache Spark is an open-source platform which offers a multi-language engine for executing data engineering, data science, and machine learning on single-node machines or clusters. Users can perform exploratory data analysis (EDA) on petabyte-scale data (with one petabyte equivalent to 1,024 TB) without having to resort to downsampling. Apache also utilizes memory caching, which keeps the data for users to quickly retrieve the next time it’s needed.
| Pros | Cons |
|---|---|
| High processing speed due to in-memory processing and data parallelism capabilities | Requires a lot of memory for processing large datasets |
| Requires a lot of memory for processing large datasets, which can be costly | Customer support could be better |
| Self-service analytics features |
Big data analytics tools provide a wide range of features and capabilities, but the top solutions offer some key functionalities for various big data applications. To determine the best big data analytics tools for your business, consider the features detailed below.
There are multiple types of analytics capabilities with different models for various types of analysis including: predictive data mining, decision trees, time series, neural networks, path analysis, market basket analysis, and link analysis.
Organizations often need additional statistical tools and programming languages (such as R) to conduct other forms of custom analysis. In such cases, the ability to integrate with their data analytics platform is essential.
Getting data in and out of various tools is a critical feature and understanding how difficult (or easy) it is to connect the analytics tool to the big data repository is a key consideration.
Seeing the numbers is one thing, but having data displayed in a graphical format often makes the data more usable.
Big Data can be big to start with, and generally has a tendency to grow even bigger over time. Organizations need to consider and understand the scalability options for the analytics tools they choose.
Analysis can sometimes be a solitary exercise, but more often than not it involves collaboration.
We reviewed the best big data analytics tools based on six primary weighted criteria consisting of specific subcriteria. We then assigned criteria scores out of five for each tool and totaled the scores, identifying a winner in each category as well as the overall top big data analytics tool. Finally, we assigned a primary use case to each big data analytics tool that made our list.
We started by assessing the core features and advanced tools offered by each option, since the top options offer standard big data technologies and premium features. We then looked into customization and integration, followed by cost and ease of use. Customer support solutions wrapped up our review.
We assessed the key capabilities offered by each option including data import and export, time series tool, visual analytics, and predictive mining. Criteria Winner: Tableau
We looked into premium features such as data visualization, scalability, AI/machine learning, and more. Criteria Winner: TIBCO Spotfire
Here, we evaluated each tool capability to tailor reports, dashboards, user access, and other features to their organization’s needs. We also looked at how well each option syncs with third-party integrations like Microsoft, Hadoop Technology, and more. Criteria Winner: Tableau
This includes the pricing for basic and enterprise tiers, free trials, billing options, and pricing transparency. Criteria Winner: Microsoft Power BI
We considered how real users across certified review sites perceive the overall design of the tool’s interface and learning curve. We also looked at each option’s knowledge base or learning resources available. Criteria Winner: Sisense
We checked user feedback and ratings on reputable sites and looked into the support solutions offered by each tool via live chat, phone, and email. Criteria Winner: SAS Visual Analytics
Big data analytics tools are software or platforms designed to help organizations and businesses process, analyze, and visualize large sets of complex data. These tools enable users to generate valuable insights from massive data repositories, which are used to derive actionable insights for improving productivity, driving revenue, and optimizing performance.
The most commonly used tools for streaming big data analytics are usually found in engines that allow data to be published, subscribed to, and processed in real-time. Platforms that stream process large volumes of data include features like windowing, event-time processing, and fault tolerance for accurate data analysis.
To determine which big data analytics tools suit your business, assess your goals, resources, and big data challenges you’d like to address. Also consider key factors like your desired data volume, processing speed, and scalability when narrowing down analytics tools to evaluate. Dig deeper into each option’s features and limitations, as well as seek professional advice or learn best practices in your industry, to find a tool that aligns with your needs.
Big data analytics tools enable businesses and organizations to examine large volumes of data and extract actionable insights that drive growth, productivity, and revenue. While most analytics tools offer standard features for data processing, reporting, and visualization, each option differs in its advanced features, customization, and usability. Let our list be a guide in determining which big data analytics tools have the overall capabilities that better suit your business.
If you’d like to browse through other data analytics platforms, see our in-depth review of the top data analytics tools and software.

Datamation is the leading industry resource for B2B data professionals and technology buyers. Datamation's focus is on providing insight into the latest trends and innovation in AI, data security, big data, and more, along with in-depth product recommendations and comparisons. More than 1.7M users gain insight and guidance from Datamation every year.
Advertise with TechnologyAdvice on Datamation and our other data and technology-focused platforms.
Advertise with Us


Property of TechnologyAdvice.
© 2025 TechnologyAdvice. All Rights Reserved
Advertiser Disclosure: Some of the products that appear on this
site are from companies from which TechnologyAdvice receives
compensation. This compensation may impact how and where products
appear on this site including, for example, the order in which
they appear. TechnologyAdvice does not include all companies
or all types of products available in the marketplace.