
Math phobia drives me nuts. We all know there are lots of former English majors in the marketing and sales departments who appear to have an allergy to math.In most cases it’s simply due to fear or ignorance based on a lousy experience in elementary school that typically led to bad deals on car leases or other major purchases.
However, their aversion to doing a deep dive into a pool of data to glean an understanding of a trend or otherwise gain insights has been a major impediment to empowering legions of customer service reps, telemarketers, sales clerks and other front-line staff. And it frequently leads to some rudimentary help desk requests (a manager once asked me how to calculate a percentage).
The rise of the integrated graphics component of early spreadsheets 20-plus years ago enabled a small subset of corporate users to better determine trends from mounds of numbers. In the past few years, though, advanced data visualization has vastly improved the ability of IT to ease the math phobic into the growing mainstream analytics movement.
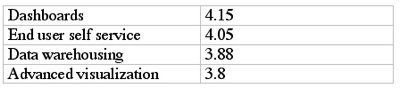
Indeed, a new survey by Dresner Advisory Services is finding that advanced data visualization is moving from an esoteric capability into the mainstream. Preliminary responses to Howard Dresner’s latest annual business intelligence and analytics deployment survey found that advanced visualization is the fourth most important technology in organizations’ business intelligence strategy and plans (see table below).
Advanced visualization ranked way higher in importance than Big Data, the cloud, social media analytics and a host of other major BI buzzwords du jour, according to the roughly 400 respondents to the global survey of IT and business unit managers at organizations of all sizes. On a rising scale of importance, from one to five, they rated advanced visualization at 3.8, within spitting distance of the top-rated technology, dashboards:
“By advanced visualization I mean extensive use of color, size, shape, 3D, texture, motion, etc. to convey meaning,” explains Howard Dresner, the former Gartner analyst who’s known for coining the phrase business intelligence. “This would include heat maps and tree maps.”
Providing advanced analytics to a wide variety of knowledge workers, managers, executives and professionals within an organization is also becoming crucial as more companies embark on Big Data adventures. As Dresner notes, “as the volume of data grows in volume and complexity, visualization helps to make sense of it more readily.”
Another important shift in the use of advanced analytics is the broadening of the industry interest. Traditionally, financial services, telecommunications companies, the government, pharma and bio tech and consumer packaged goods companies were the only users of advanced visualization. Not so, according to early survey results – advanced visualization is considered very important across all sectors these days.
While interest in analyzing social media traffic is in its infancy, and the tools remain immature, the importance of using advanced visualization to process and highlight key trends is clear. Heat maps and other graphical ways of depicting relative interest in certain topics or issues are becoming standard operating procedure in most companies as a way of successfully communicating trends to the masses.
Indeed, preliminary survey results show that advanced visualization, dashboards and the other key technologies have led to a rather strong endorsement of business intelligence in general. When asked whether their BI implementations are considered a success by their organizations, more than eight out of 10 respondents agreed, to one extent or another. Prior surveys I’ve done in the past found similarly high levels of success and regard for BI implementations. This is quite a refreshing change from the normal condemnation of other enterprise applications over the years.
The future of advanced visualization is being driven by a few key trends in addition to Big Data and the cloud. The rise of in-memory appliances enables a wide range of users to interactively manipulate the data in real time.
“Interactive visualization,” as noted in an upcoming report by Pricewaterhouse Coopers, is the result of having a lot of computer horsepower applied to a lot of data with a series of advanced visualization tools. For example, PwC’s report (it will be posted online in a few weeks) will predict that the statistical analysis packages once only fathomed by spreadsheet jockeys are being encapsulated in more user friendly interfaces as well as providing better visualization outputs.
Dresner and others note that many of these advanced visualization tools, initially introduced by start-ups like Tableau, are now finding their way into mainstream BI toolsets from Oracle and SAP Business Objects. Being part of the almost ubiquitous enterprise platform used by millions of staffers will definitely drive more and better decisions, and maybe make a few math phobics more comfortable with data.
One can only hope.
By the way, if you want to participate in the current BI survey by Howard Dresner, and get an early look at the final report, go to this survey web site.
Huawei’s AI Update: Things Are Moving Faster Than We Think
FEATURE | By Rob Enderle,
December 04, 2020
Keeping Machine Learning Algorithms Honest in the ‘Ethics-First’ Era
ARTIFICIAL INTELLIGENCE | By Guest Author,
November 18, 2020
Key Trends in Chatbots and RPA
FEATURE | By Guest Author,
November 10, 2020
FEATURE | By Samuel Greengard,
November 05, 2020
ARTIFICIAL INTELLIGENCE | By Guest Author,
November 02, 2020
How Intel’s Work With Autonomous Cars Could Redefine General Purpose AI
ARTIFICIAL INTELLIGENCE | By Rob Enderle,
October 29, 2020
Dell Technologies World: Weaving Together Human And Machine Interaction For AI And Robotics
ARTIFICIAL INTELLIGENCE | By Rob Enderle,
October 23, 2020
The Super Moderator, or How IBM Project Debater Could Save Social Media
FEATURE | By Rob Enderle,
October 16, 2020
FEATURE | By Cynthia Harvey,
October 07, 2020
ARTIFICIAL INTELLIGENCE | By Guest Author,
October 05, 2020
CIOs Discuss the Promise of AI and Data Science
FEATURE | By Guest Author,
September 25, 2020
Microsoft Is Building An AI Product That Could Predict The Future
FEATURE | By Rob Enderle,
September 25, 2020
Top 10 Machine Learning Companies 2020
FEATURE | By Cynthia Harvey,
September 22, 2020
NVIDIA and ARM: Massively Changing The AI Landscape
ARTIFICIAL INTELLIGENCE | By Rob Enderle,
September 18, 2020
Continuous Intelligence: Expert Discussion [Video and Podcast]
ARTIFICIAL INTELLIGENCE | By James Maguire,
September 14, 2020
Artificial Intelligence: Governance and Ethics [Video]
ARTIFICIAL INTELLIGENCE | By James Maguire,
September 13, 2020
IBM Watson At The US Open: Showcasing The Power Of A Mature Enterprise-Class AI
FEATURE | By Rob Enderle,
September 11, 2020
Artificial Intelligence: Perception vs. Reality
FEATURE | By James Maguire,
September 09, 2020
Anticipating The Coming Wave Of AI Enhanced PCs
FEATURE | By Rob Enderle,
September 05, 2020
The Critical Nature Of IBM’s NLP (Natural Language Processing) Effort
ARTIFICIAL INTELLIGENCE | By Rob Enderle,
August 14, 2020

Datamation is the leading industry resource for B2B data professionals and technology buyers. Datamation's focus is on providing insight into the latest trends and innovation in AI, data security, big data, and more, along with in-depth product recommendations and comparisons. More than 1.7M users gain insight and guidance from Datamation every year.
Advertise with TechnologyAdvice on Datamation and our other data and technology-focused platforms.
Advertise with Us


Property of TechnologyAdvice.
© 2025 TechnologyAdvice. All Rights Reserved
Advertiser Disclosure: Some of the products that appear on this
site are from companies from which TechnologyAdvice receives
compensation. This compensation may impact how and where products
appear on this site including, for example, the order in which
they appear. TechnologyAdvice does not include all companies
or all types of products available in the marketplace.


